Introducing Visualizations in PortalJS Cloud: Publish and Share Insights Alongside Your Datasets

João Demenech
Introduction
PortalJS Cloud now treats visualizations as first-class citizens in your data portal — discoverable and searchable, just like your datasets.
This feature allows users to publish external dashboards, reports, and data stories alongside their datasets, regardless of which tool they use — from Power BI to Tableau or custom-built data apps.
Why Visualizations Matter
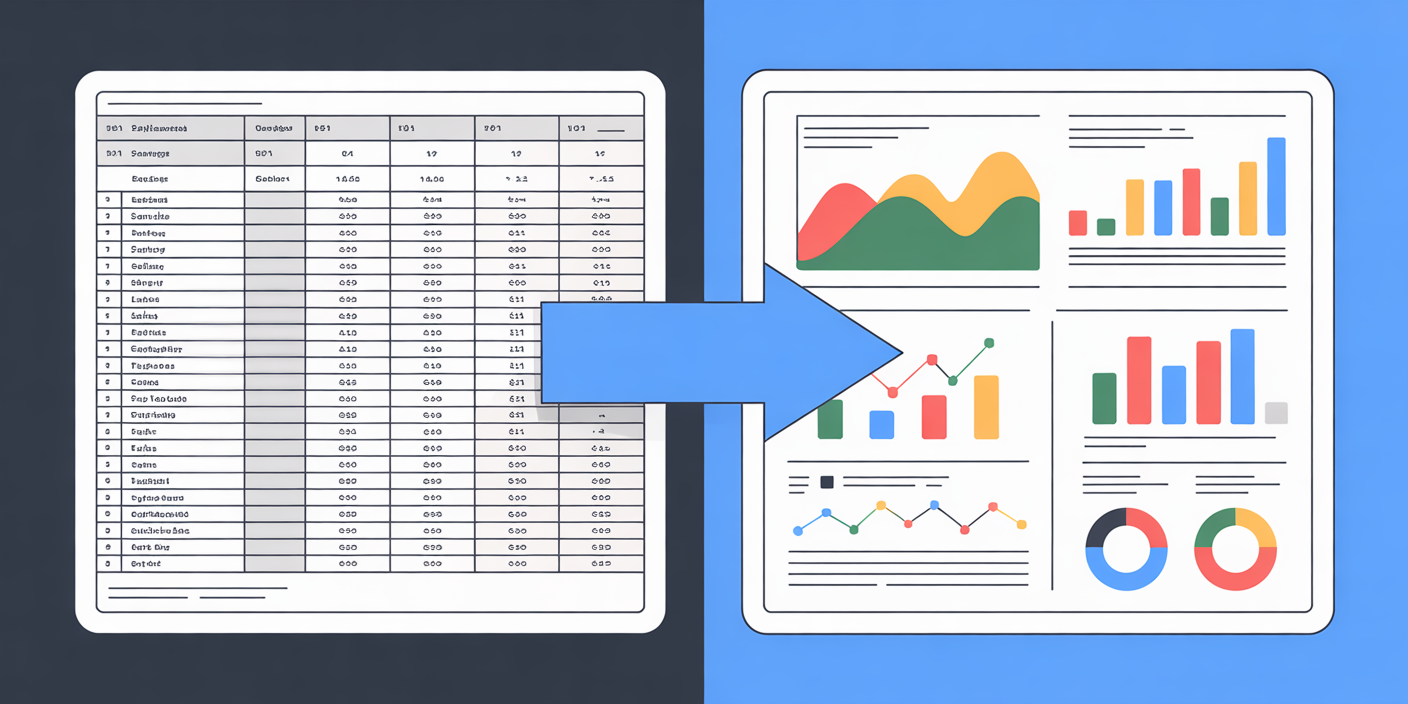
Data portals are great for publishing and discovering datasets, but raw data rarely tells the full story.
Visualizations bridge that gap by helping users:
- Quickly grasp insights and trends
- Lower the barrier for non-technical audiences
- Combine narrative and analysis into data-driven storytelling
- Share interactive dashboards directly with stakeholders
Tool-Agnostic by Design
A core design goal for this feature was flexibility.
PortalJS doesn’t restrict you to one visualization framework. Instead, you can publish and catalog visualizations created with any external tool, such as:
- Power BI
- Observable
- Superset
- Tableau
- Custom-built dashboards or apps
When you publish a visualization in PortalJS Cloud, it becomes:
- A dedicated entry in your PortalJS instance (with metadata, tags, and ownership)
- Linked to the relevant groups and organizations
- Browsable and searchable, just like datasets
This means your portal can now serve as both a catalog of datasets and a catalog of insights built on top of them.
Optional Add-On: Managed Data App Powered By Observable Framework
For users who prefer a code-driven workflow, PortalJS offers an optional Observable Framework Data App Add-on integration.
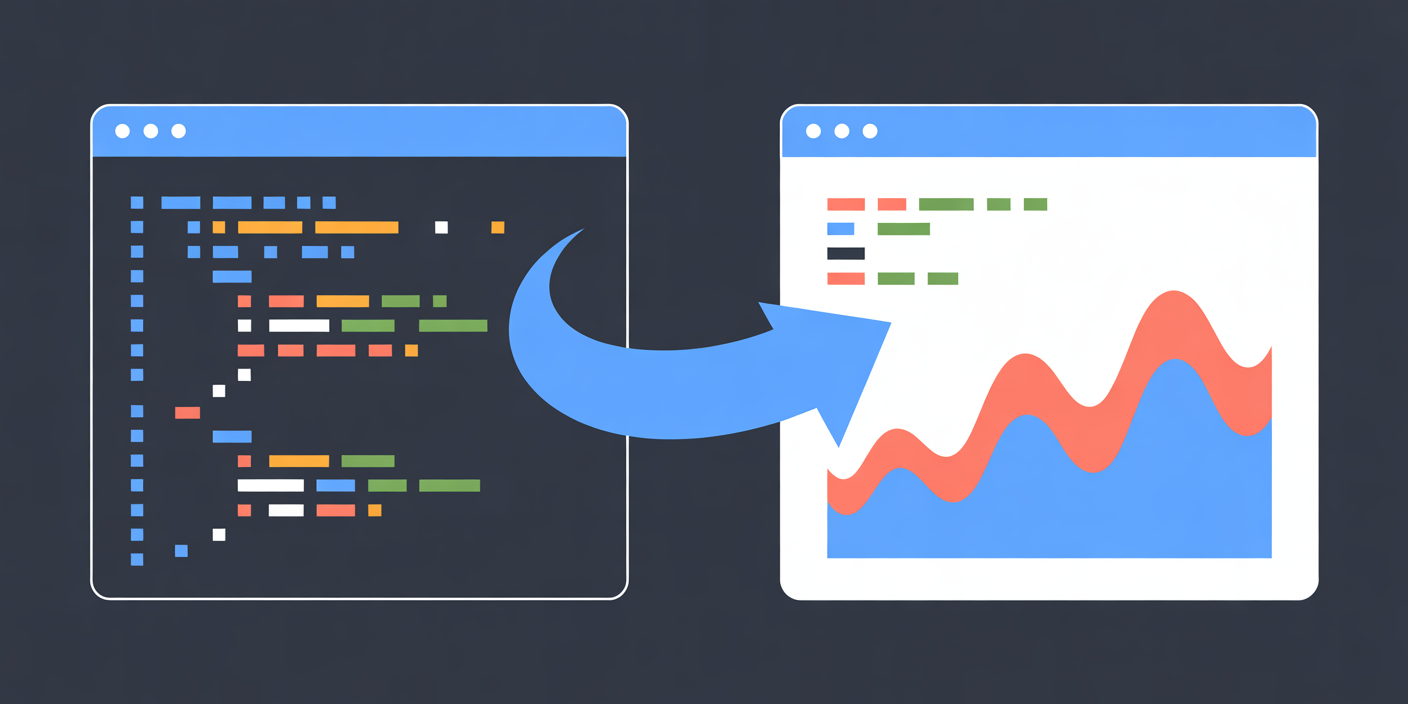
Observable Framework is an open-source JavaScript framework for building interactive data applications, dashboards, and reports. It was created by the team behind ObservableHQ, with the goal of making it easier for developers and analysts to turn data into live, shareable, and interactive visualizations using standard web technologies.
Data apps powered by the Observable Framework are static sites that can be built, deployed, and hosted anywhere — including platforms like Vercel. This makes them fast, portable, and easy to integrate into modern web stacks such as PortalJS.
The data app addon works similarly to the main data portal: once enabled on PortalJS Cloud, a dedicated GitHub repository and deployment will be created for your data app.
The GitHub repository is created based on the PortalJS Data App Starter template. You can then clone it locally for development and raise PRs to deploy changes to your data app, such as the creation of new dashboards or branding.
Publishing Visualizations
Once your dashboards and reports are deployed to the data app (or any other tool), you can then publish them in PortalJS Cloud by creating corresponding visualizations.
Browsable and Searchable Like Datasets
Finally, users will be able to explore the visualizations published to your portal and access the dashboards and reports created on the data app.
Just like with datasets, users can search visualizations by organization, groups, and tags.
On the visualization details page, the full metadata for the visualization can be found, along with a link to access it.
What’s Next
This release is just the beginning of a series of improvements focused on data visualizations.
In the next iterations, we aim to make creating and publishing visualizations as intuitive as exploring them, introducing simple, guided tools that allow non-technical users to build and customize visualizations directly within PortalJS Cloud, without needing to write code or manage external apps.
With these enhancements, we aim to make PortalJS Cloud not just a catalog of datasets and dashboards, but a platform where any user — technical or not — can explore, create, and share meaningful insights.