Which country spends the most on pharmaceutical drugs?
Meiran Zhiyenbayev
There are several graphs that illustrate pharmaceutical drug spendings from the list OECD countries. Data is clean and available in several formats such as csv, json, zip.
Pharmaceutical spending covers expenditure on prescription medicines and self-medication, often referred to as over-the-counter products. In some countries, other medical non-durable goods are also included - click here to read more.
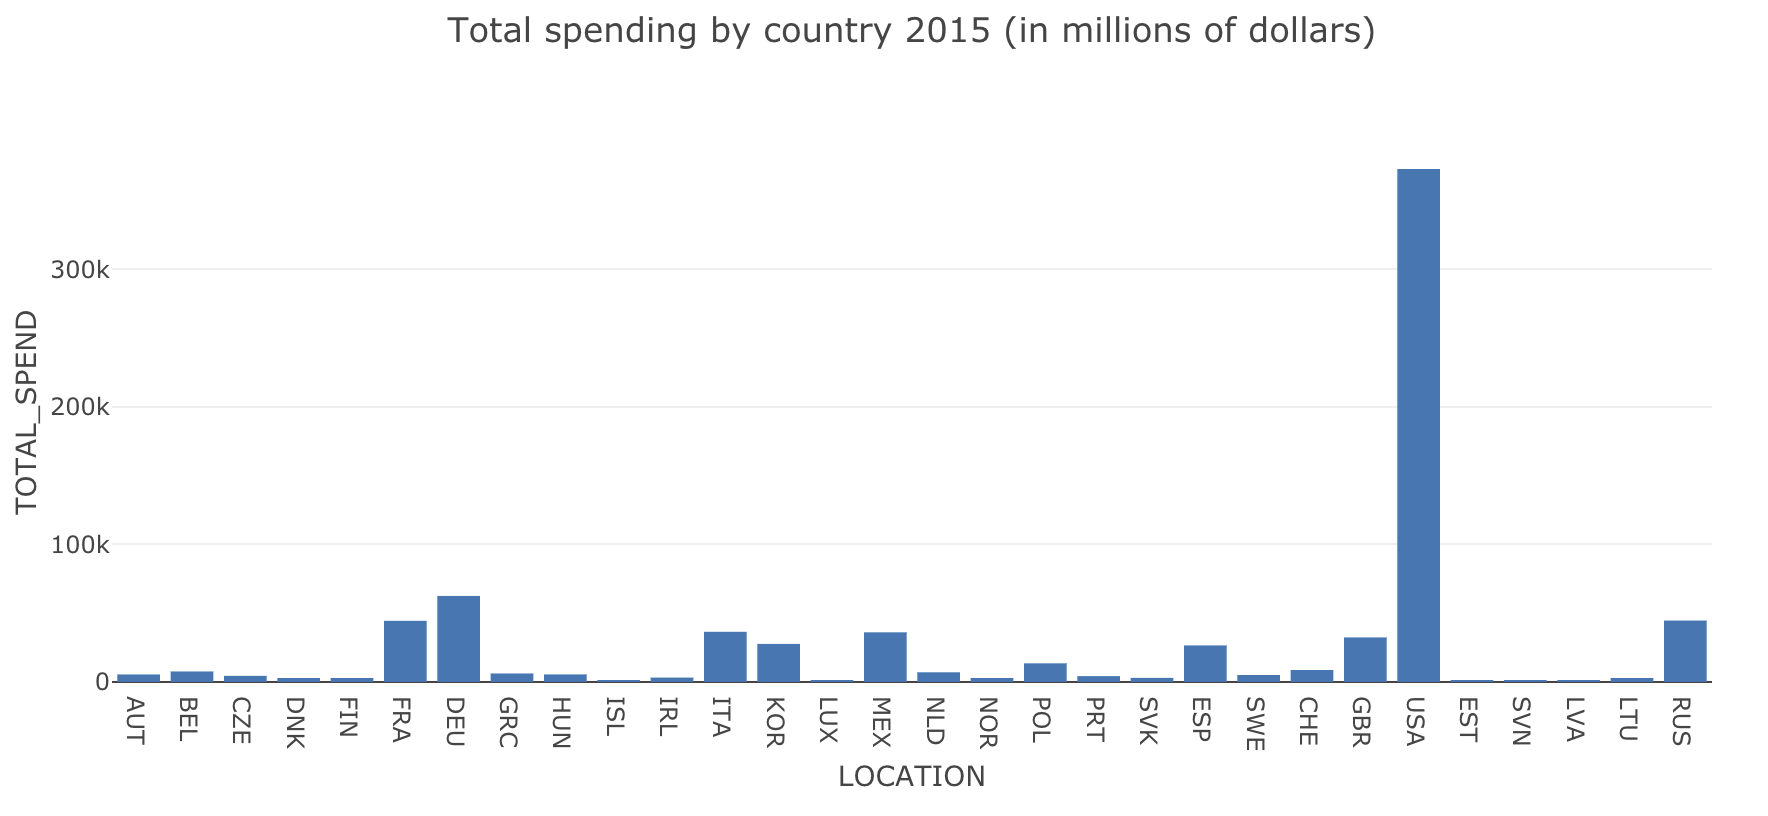
This chart illustrates total spending by country in 2015:

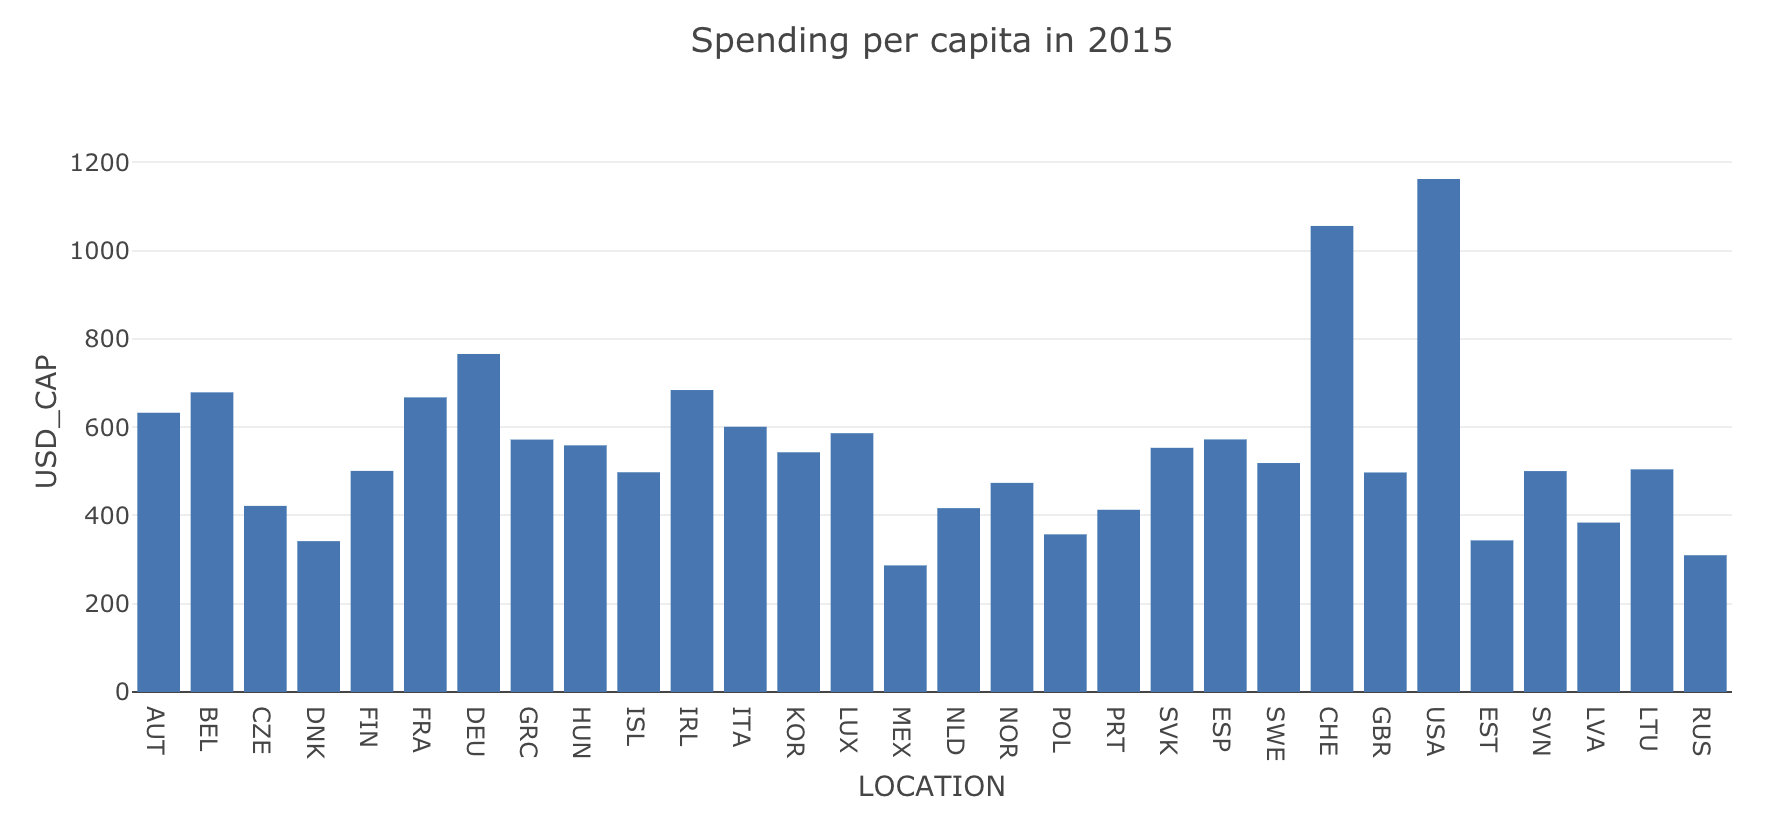
For comparison, you can take a look at spendings per capita in the same year:

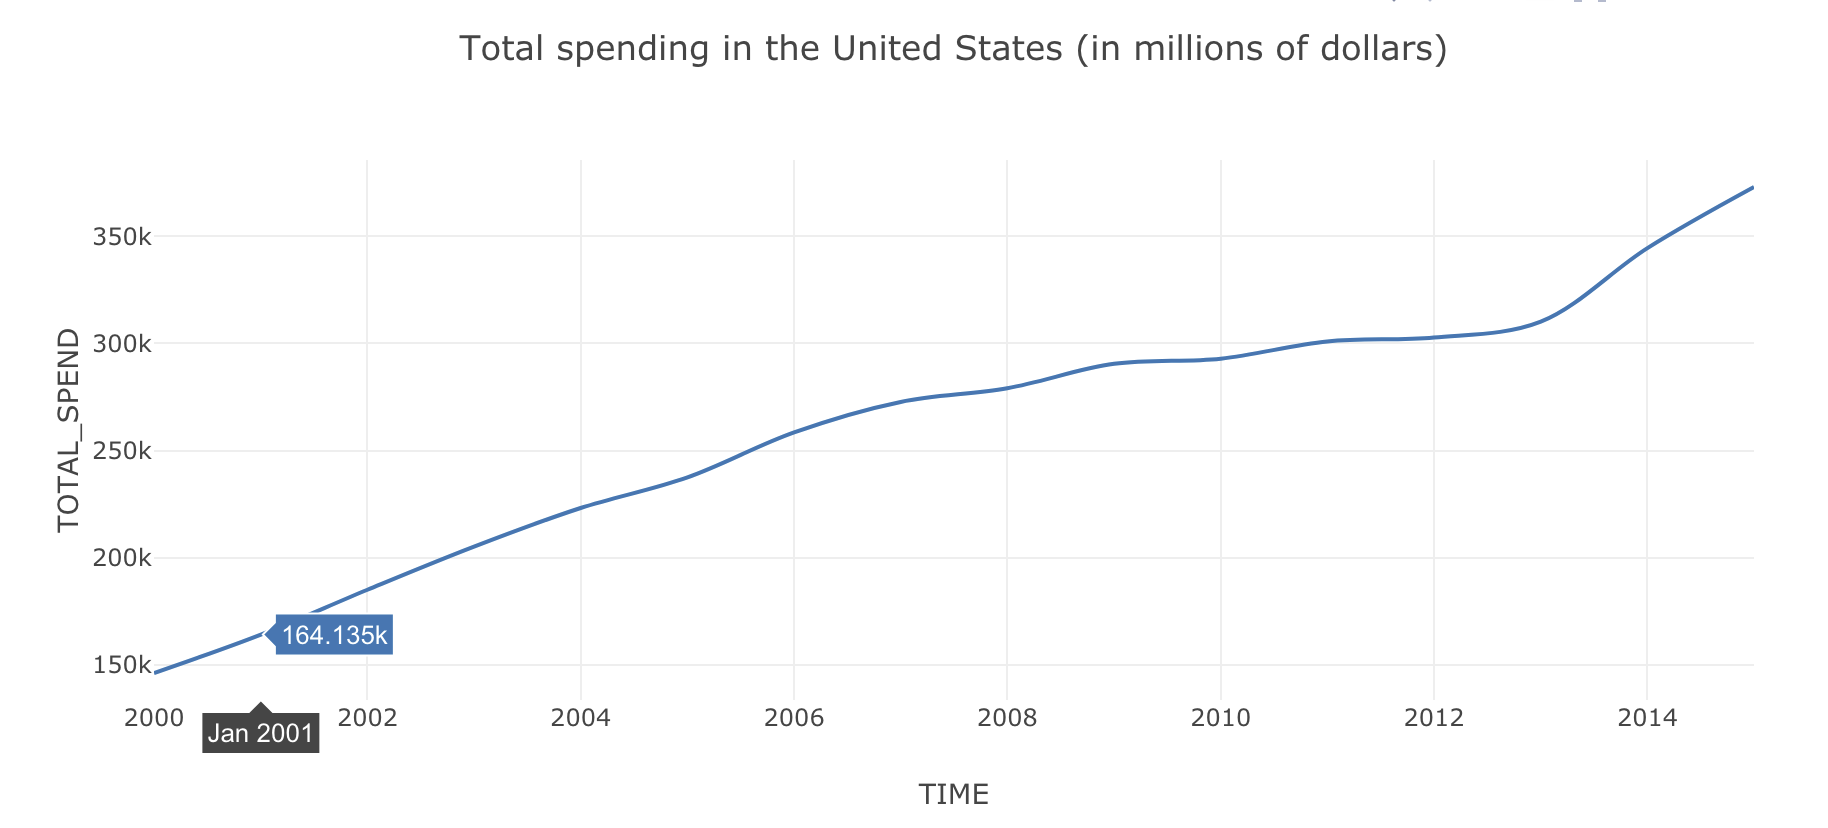
As you can see Americans spend the most on drugs compared to the rest of the world, and below you can see a chart that breaks down total spendings in the United States since 2000 and it is growing gradually:

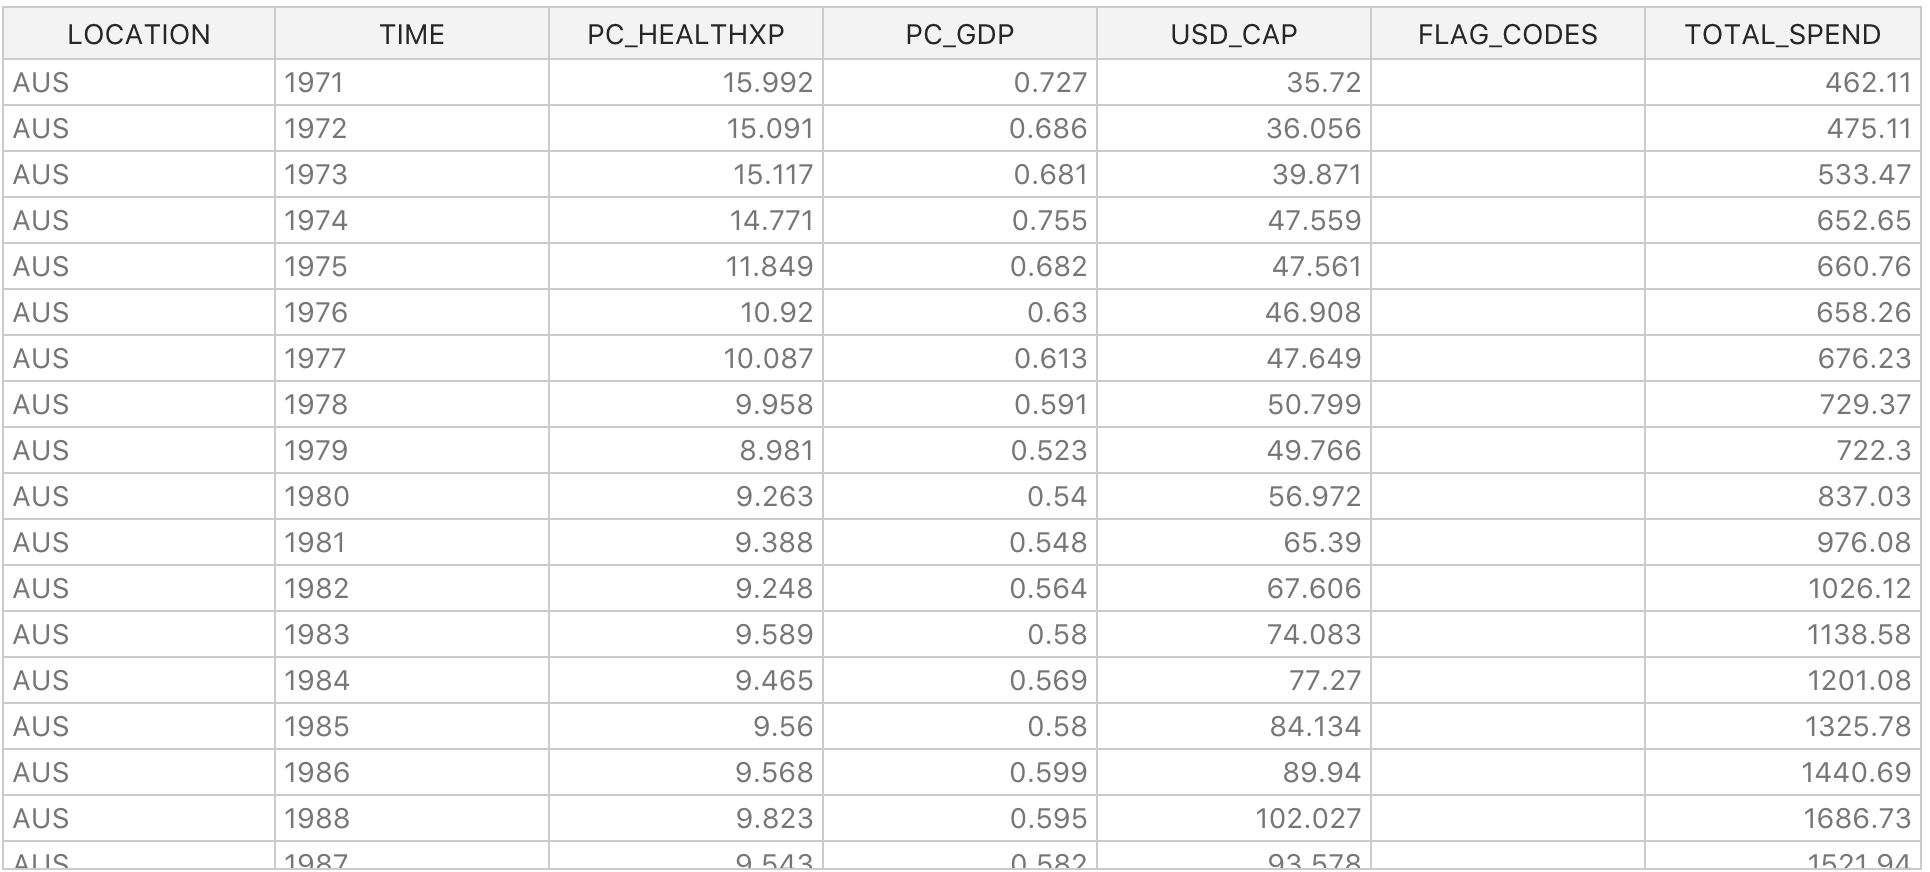
The table below describes Pharmaceutical Drug Spending dataset by countries with indicators such as a share of total health spending, in USD per capita (using economy-wide Purchasing Power Parity or PPP), as a share of GDP and total spending since 1970.

The dataset is live on DataHub. Also, you can find other well-formatted, high-quality core datasets in DataHub.