Visualizations
A visualization is a catalog record that points to an externally hosted dashboard, report, or data app via its URL. It is published to your portal alongside datasets and, when public, appears on the public site.
Like a dataset, every visualization belongs to one organization and has a visibility setting. Who can edit or delete it follows the same organization-membership model — see Permissions.
Permissions
A visualization is owned by an organization (the Organization field is required). Edit and delete rights follow the standard CKAN role model, identical to datasets: editors and admins of the owning organization can manage it. See Datasets → Permissions and Organizations → Roles.
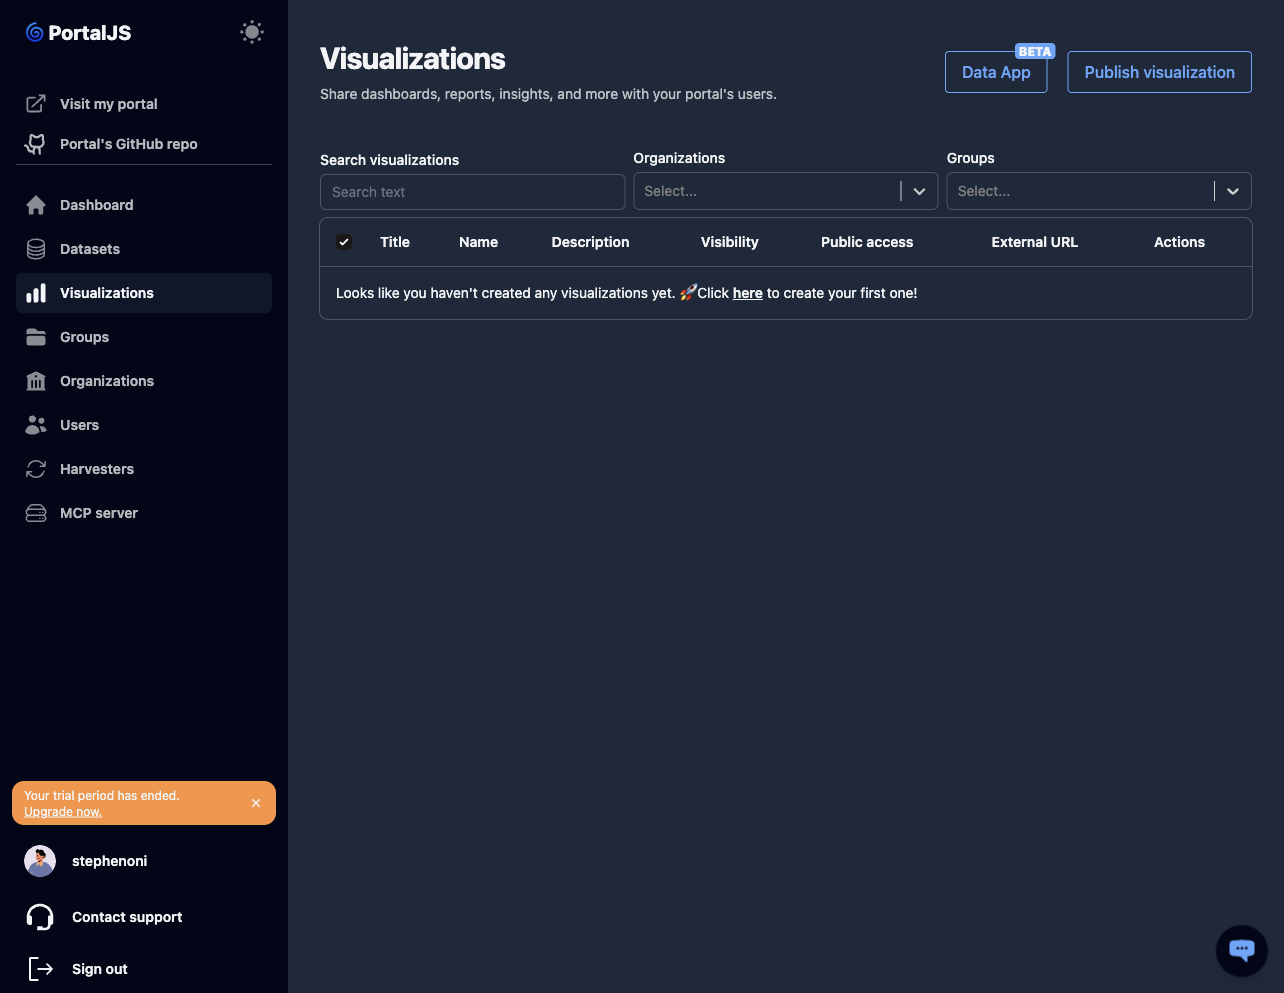
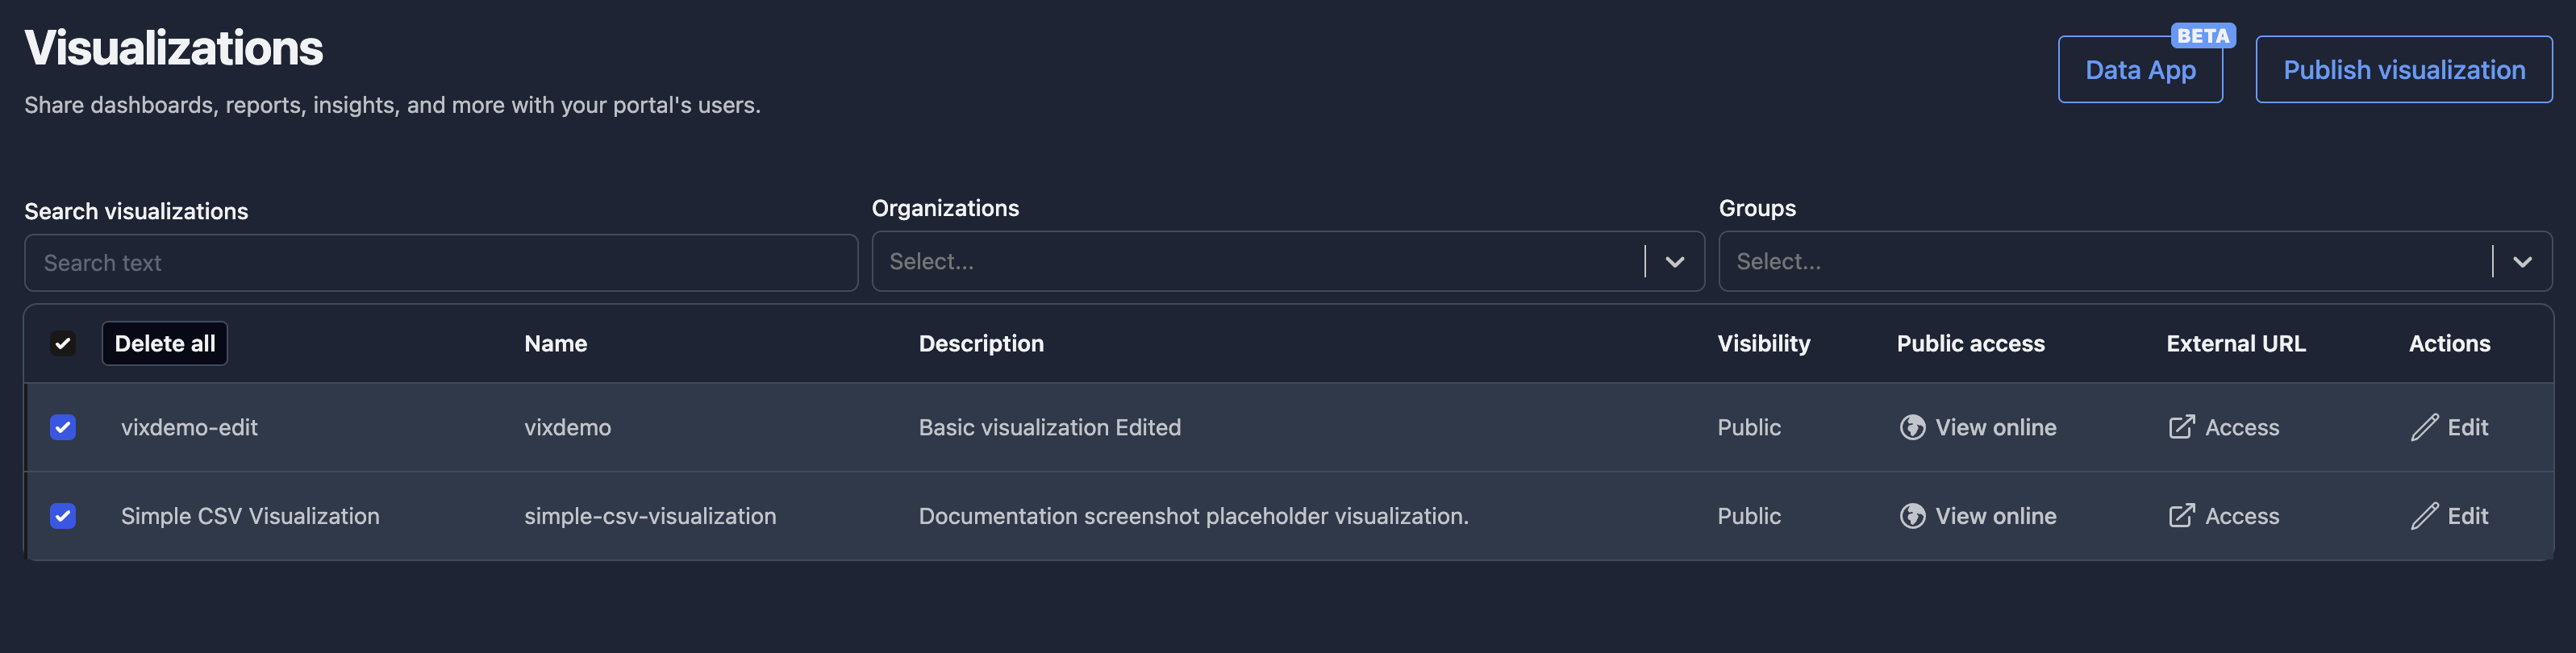
Browse visualizations
-
In the sidebar, click Visualizations.
-
The table shows each visualization's Title, Name, Description, Visibility (Public/Private), Public access (a View online link, or No online link when private), and External URL (an Access link that opens the hosted visualization in a new tab). The Actions column has an Edit link.
-
Use the search bar above the table to filter by query, organization, group, or tag.
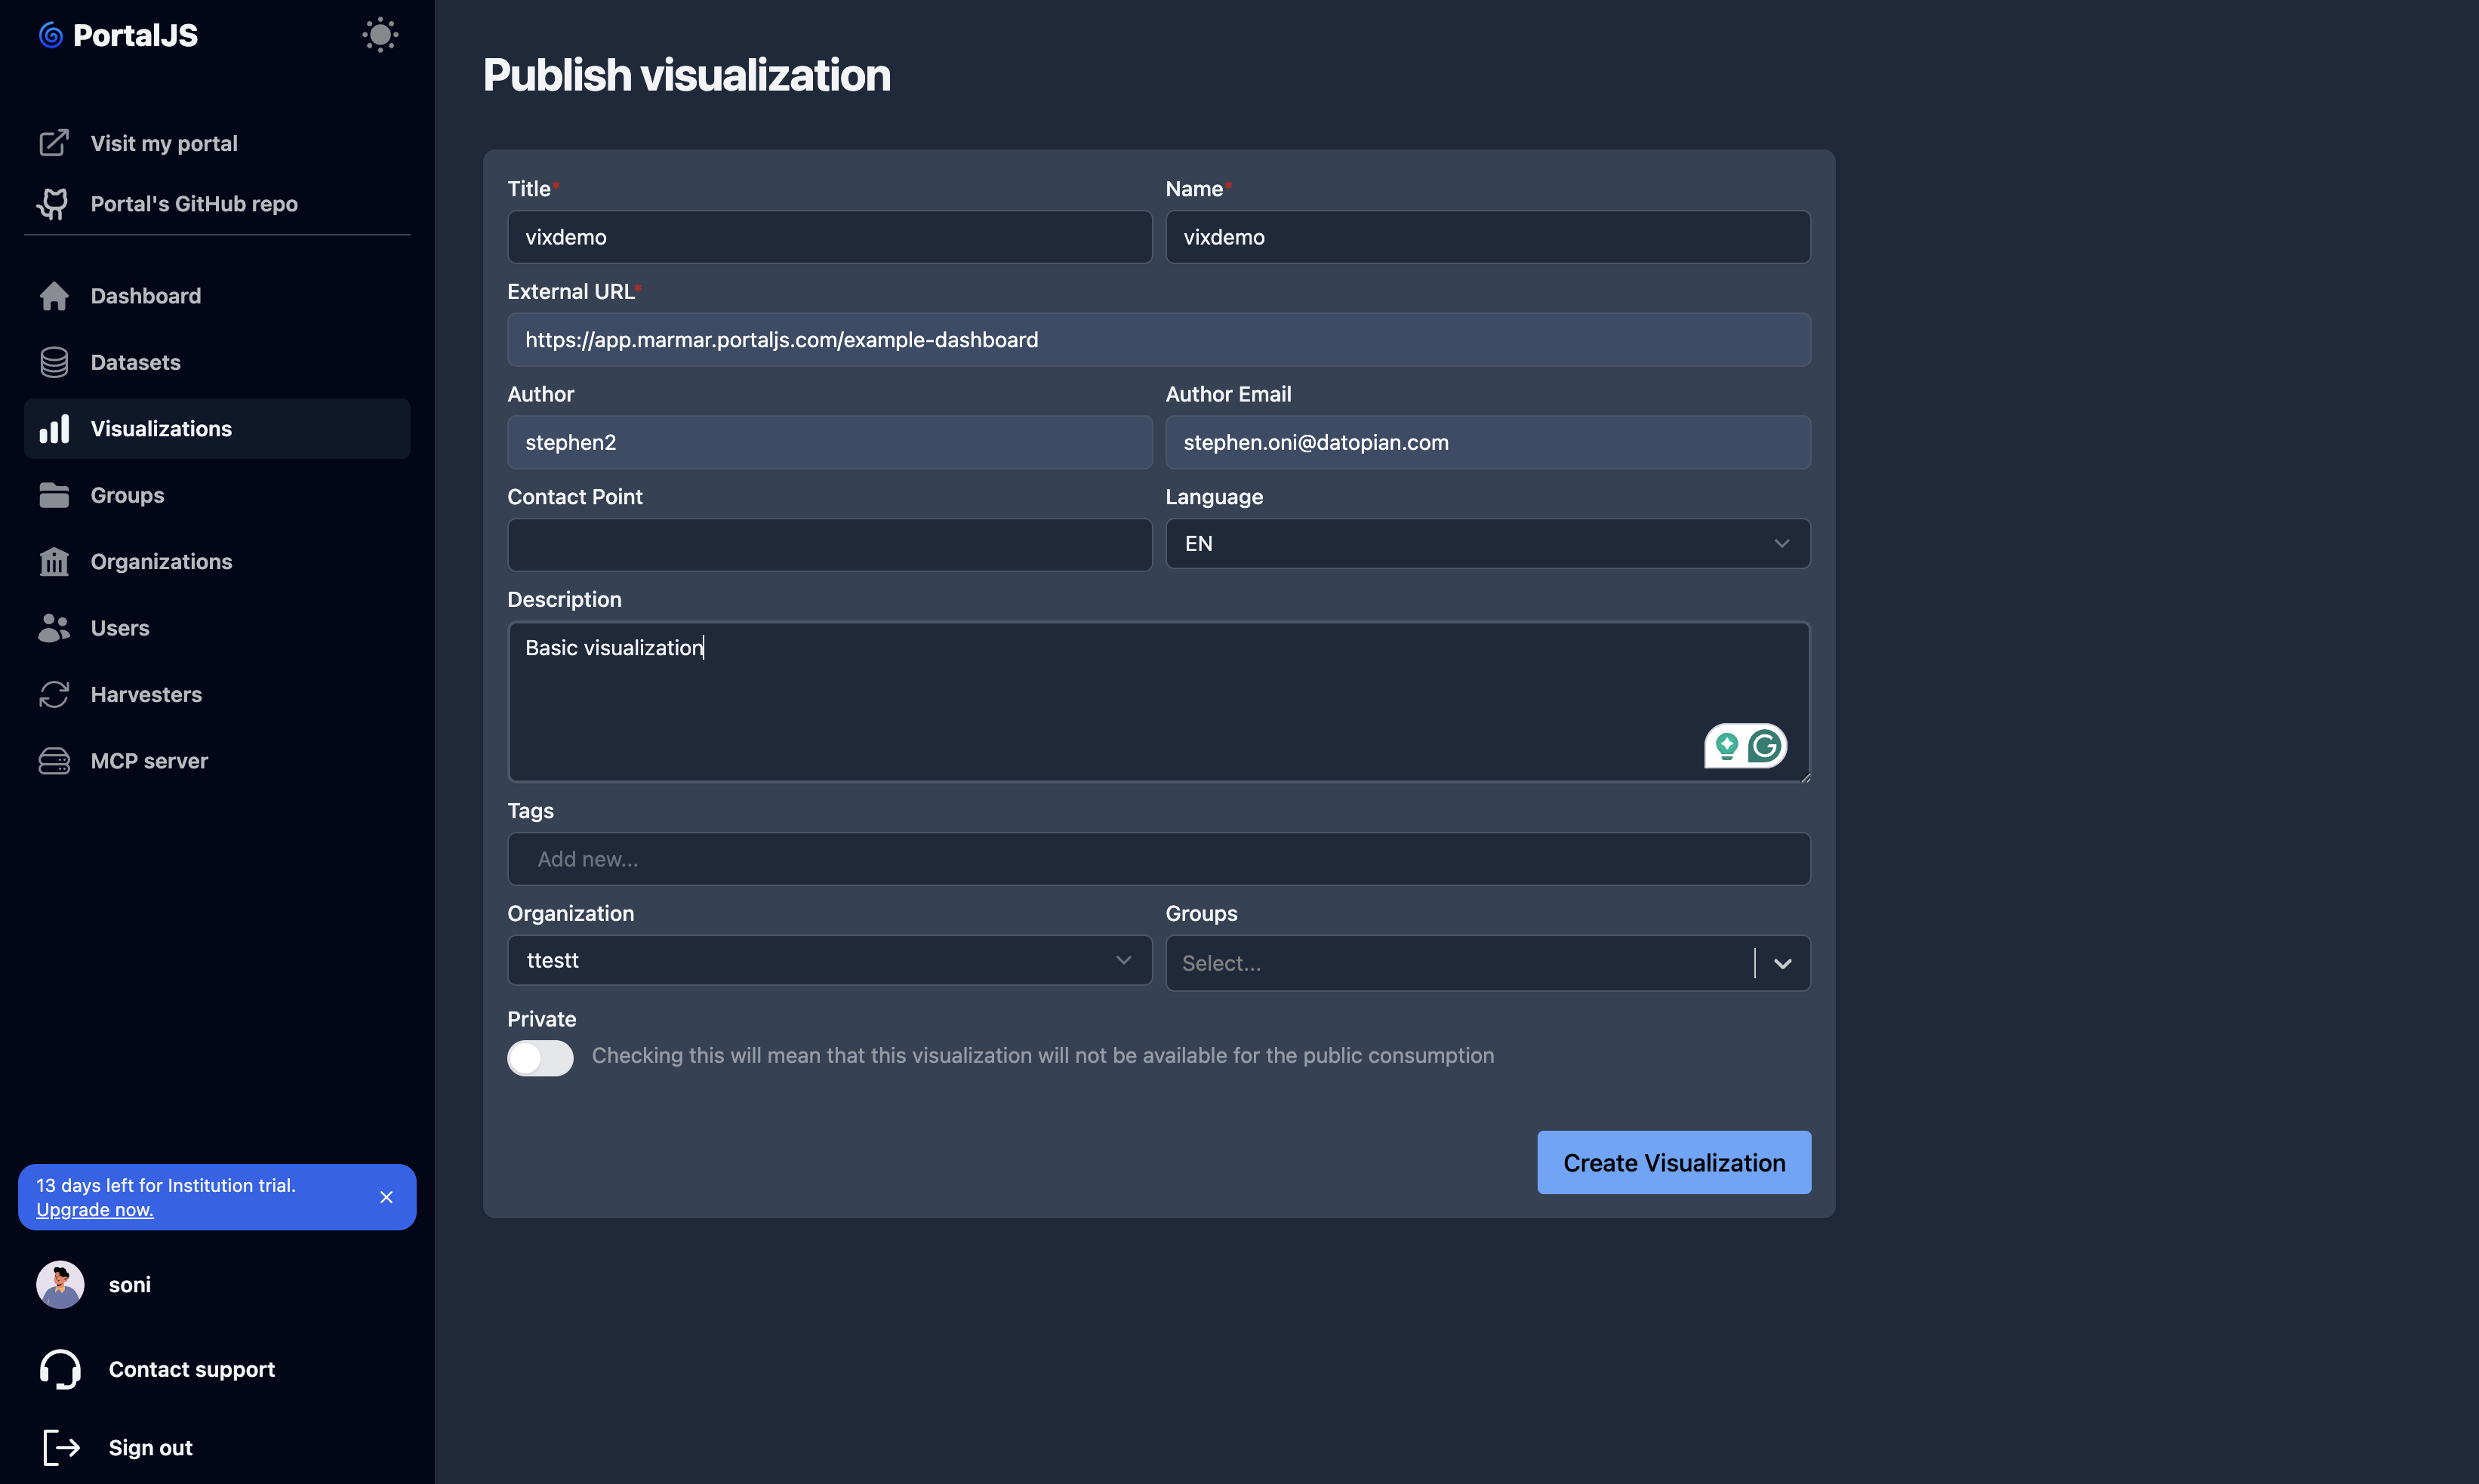
Publish a visualization
-
From the Visualizations page, click Publish visualization.
-
Fill in the form (see Visualization fields for the complete list). At minimum:
- Title.
- External URL — the address where the visualization is hosted.
- Organization — the owning organization.
-
Click Create Visualization. The visualization appears in the table and, if public, on the portal.
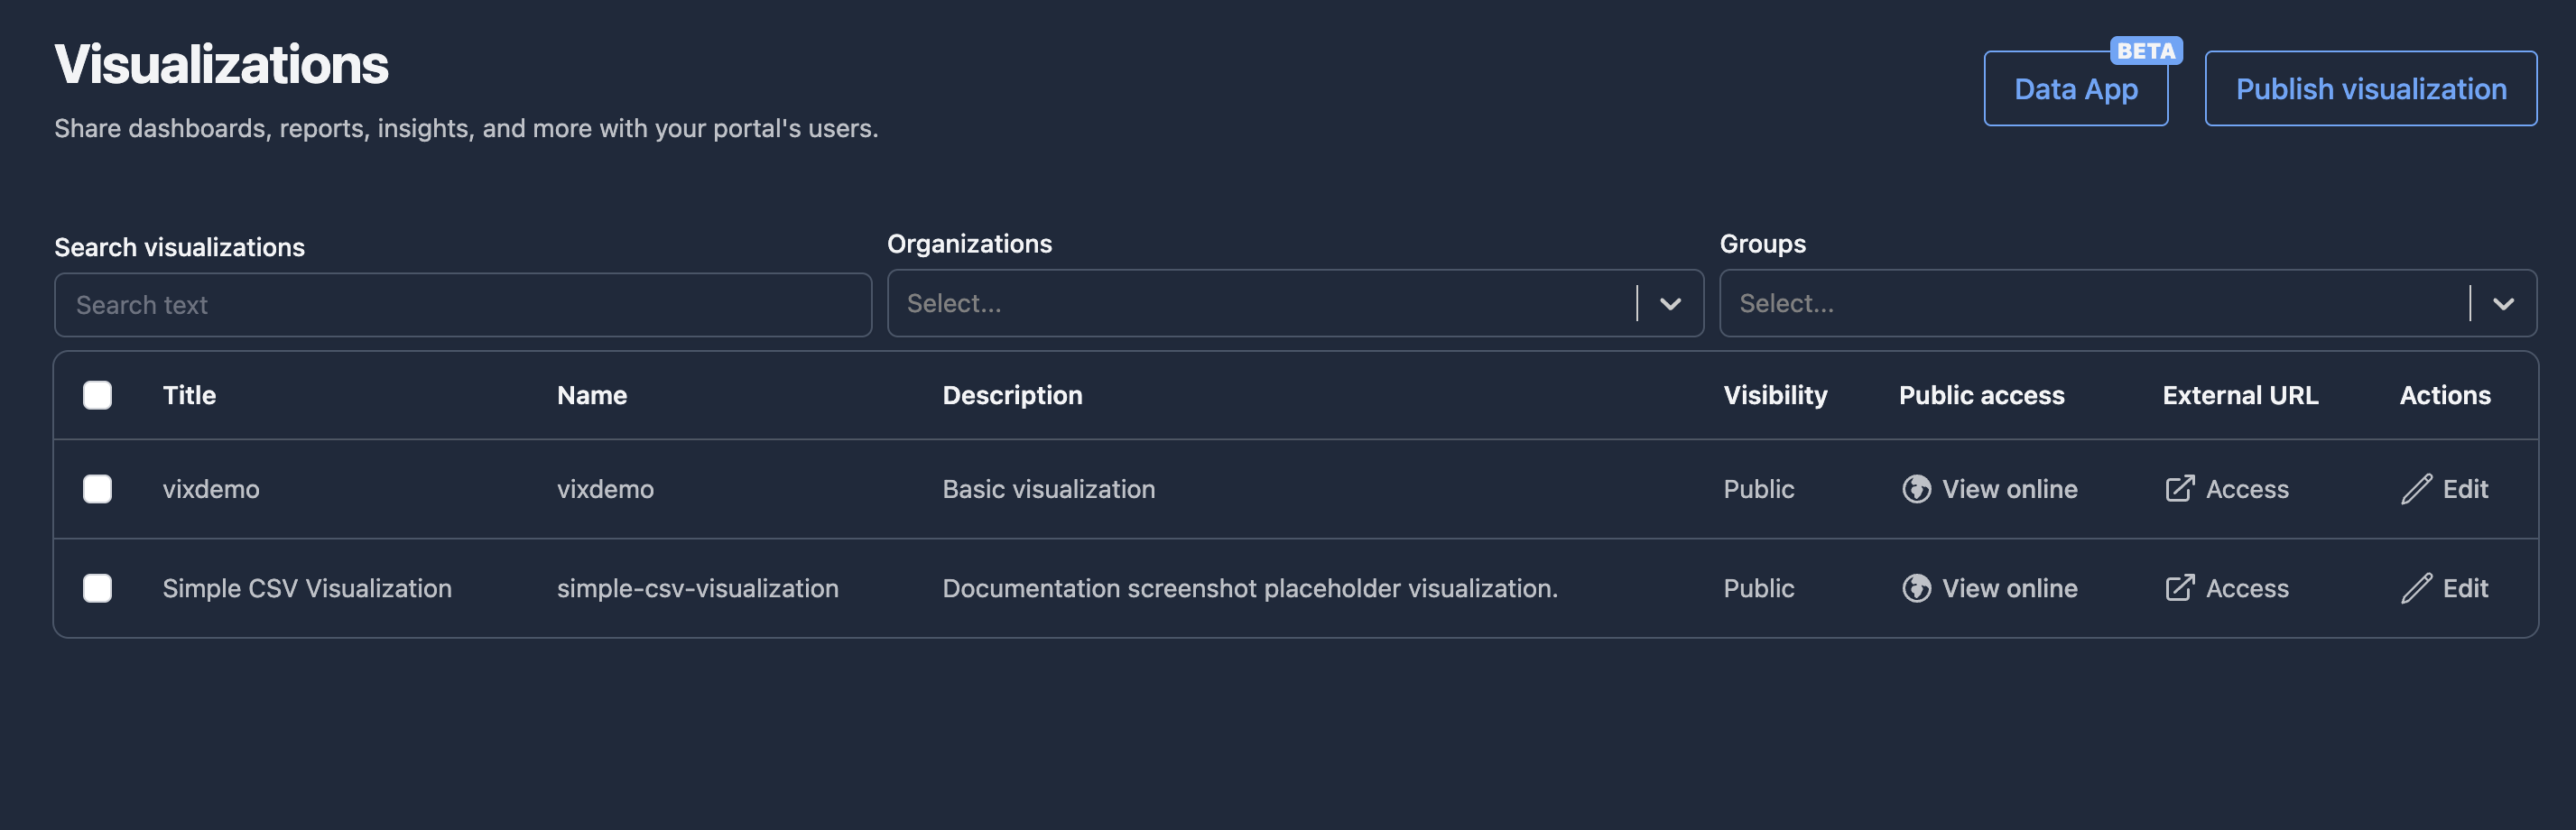
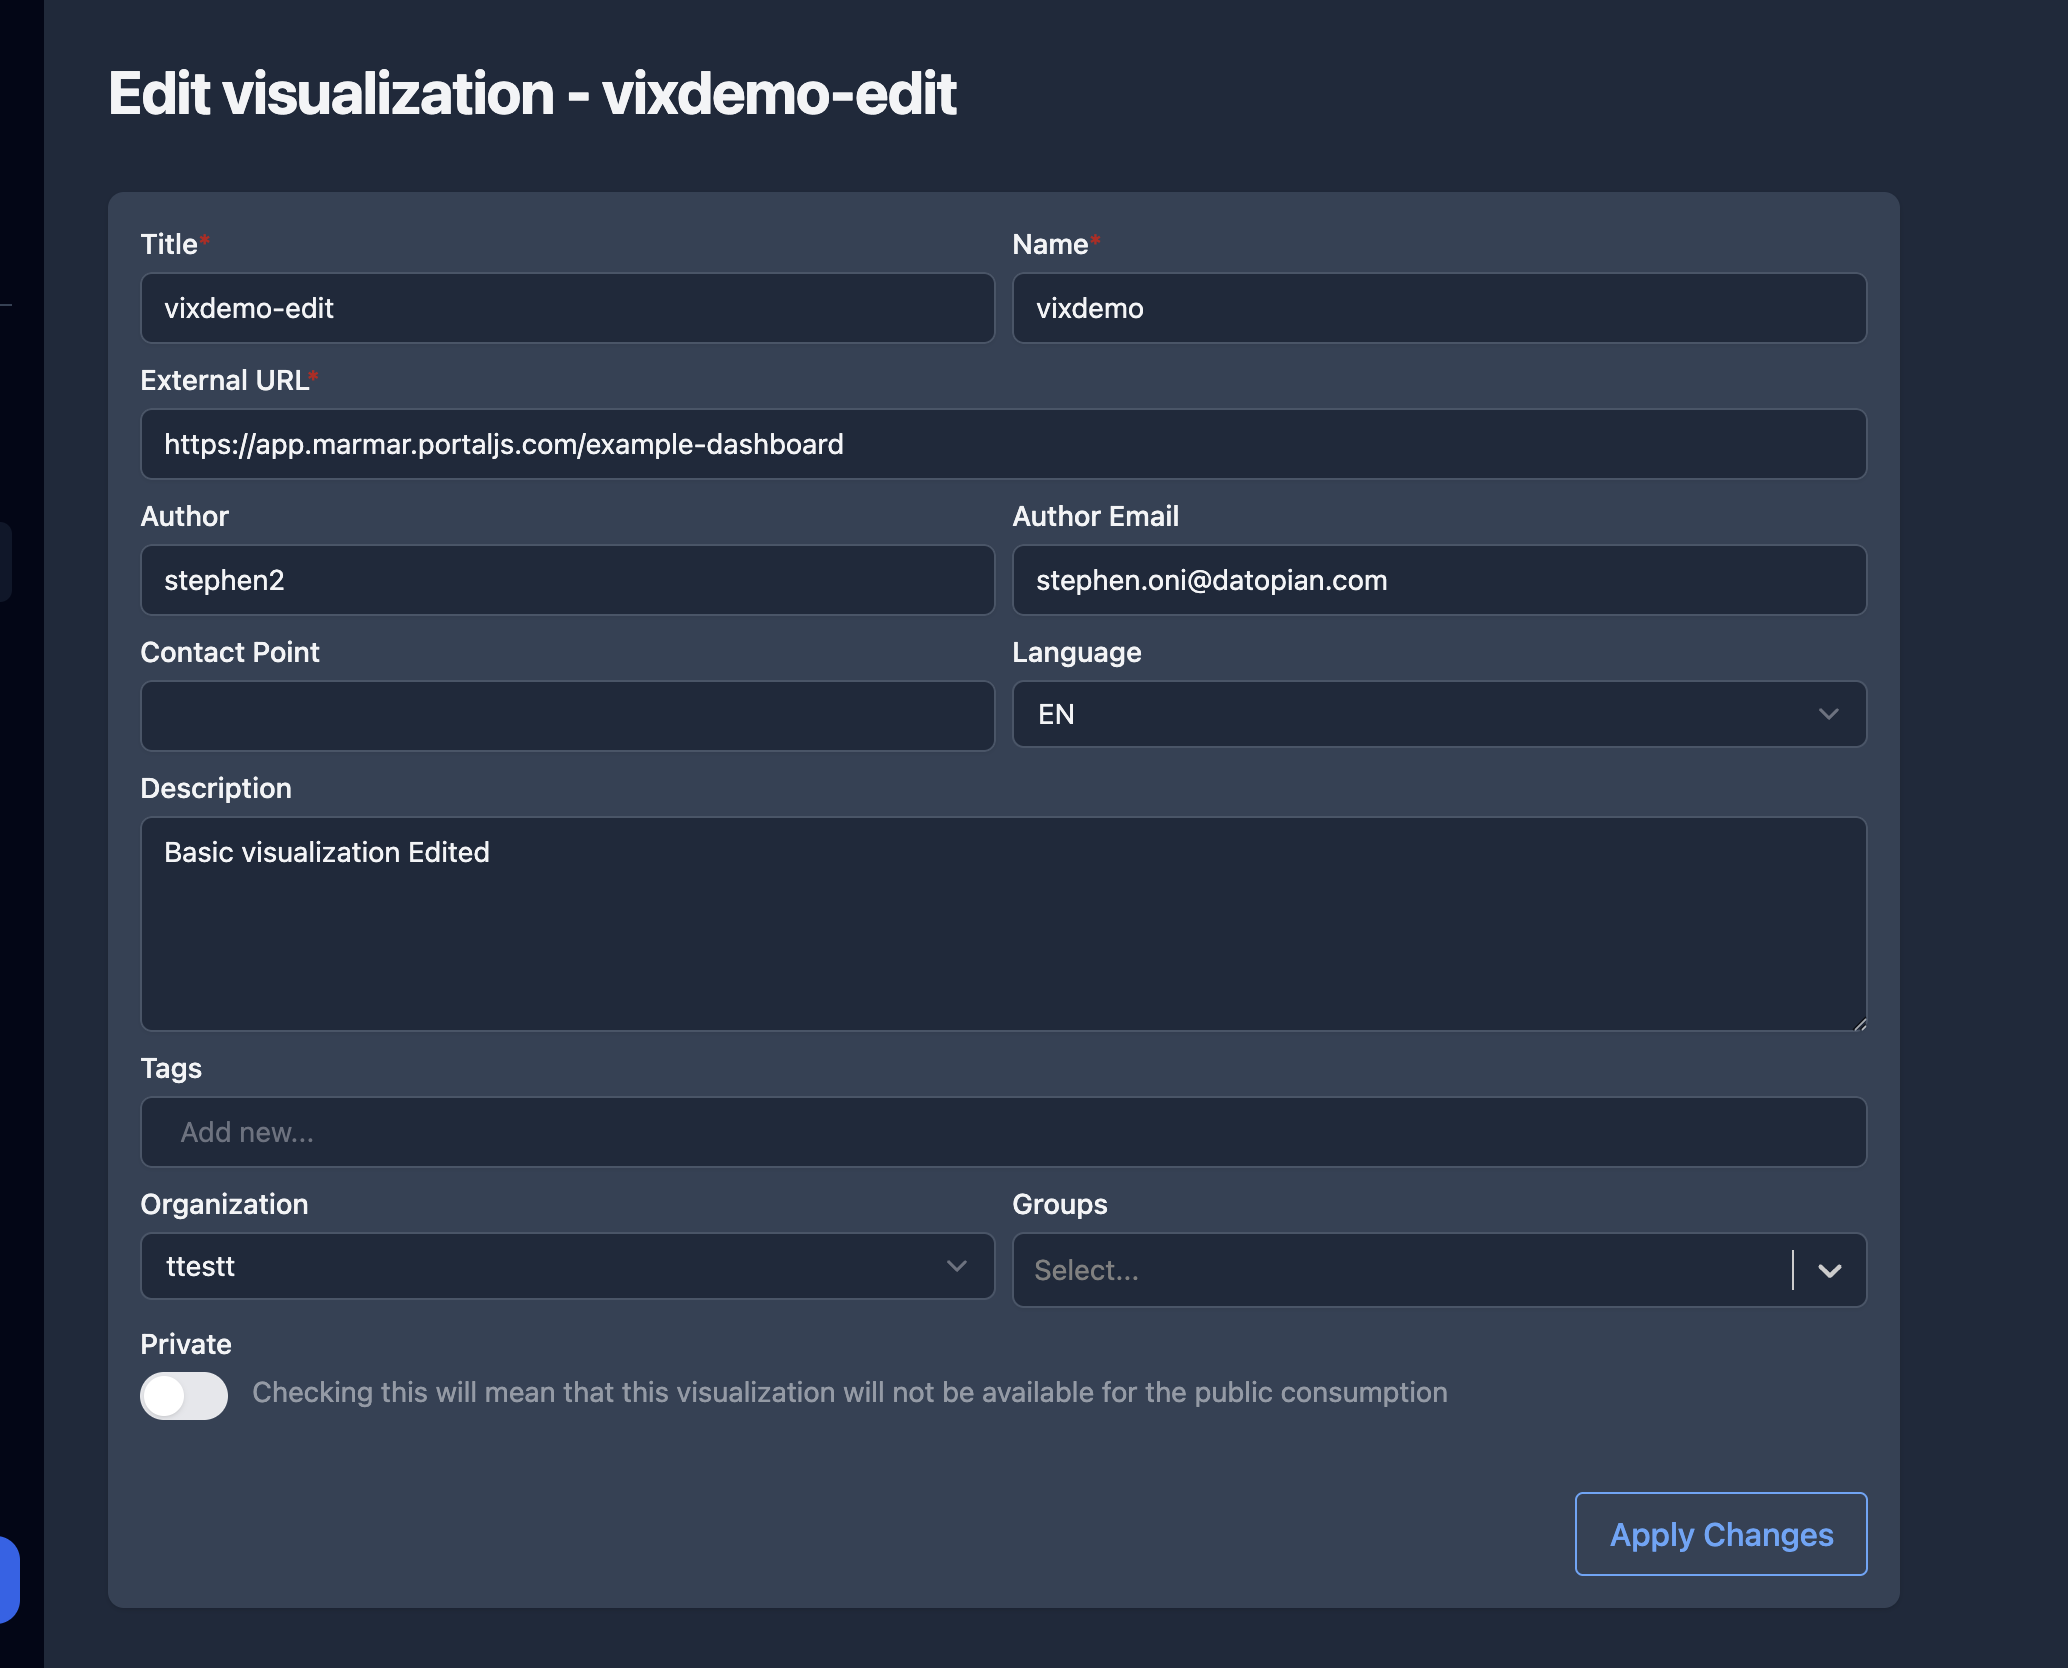
Edit a visualization
-
From the Visualizations list, click Edit on the visualization's row. This opens the edit page.
-
Update any field and click Apply Changes.
Delete visualizations
-
On the Visualizations list, tick the checkbox to the left of each visualization you want to delete. Use the header checkbox to select all.
-
Click Delete all in the toolbar that appears above the table.
-
Confirm. Deleted visualizations are removed from both the admin dashboard and the public portal.
Visibility — public vs private
Each visualization has a Private setting:
- Public — appears on the public portal; the View online link is active.
- Private — visible only in the admin dashboard; the list shows No online link.
Visualization fields
| Field | Type | Required | Description |
|---|---|---|---|
| Title | string | yes | Human-readable name shown across the portal. |
| Name | string (slug) | yes | URL-safe identifier. Lowercase letters, numbers, underscores, and dashes only. |
| External URL | URL | yes | Address of the externally hosted dashboard, report, or data app. |
Organization (owner_org) | reference | yes | The organization that owns the visualization. Controls permissions. |
| Description | text | no | Summary of what the visualization shows (stored as notes). |
| Tags | list of strings | no | Free-form keywords. |
| Groups | list of references | no | Thematic groups the visualization belongs to. |
| Author | string | no | Name of the author. |
| Author Email | string | no | Contact email for the author. |
| Contact Point | string | no | Primary contact for questions about the visualization. |
| Language | string | no | Language of the visualization. |
| Private | boolean | no | Hides the visualization from the public portal. |
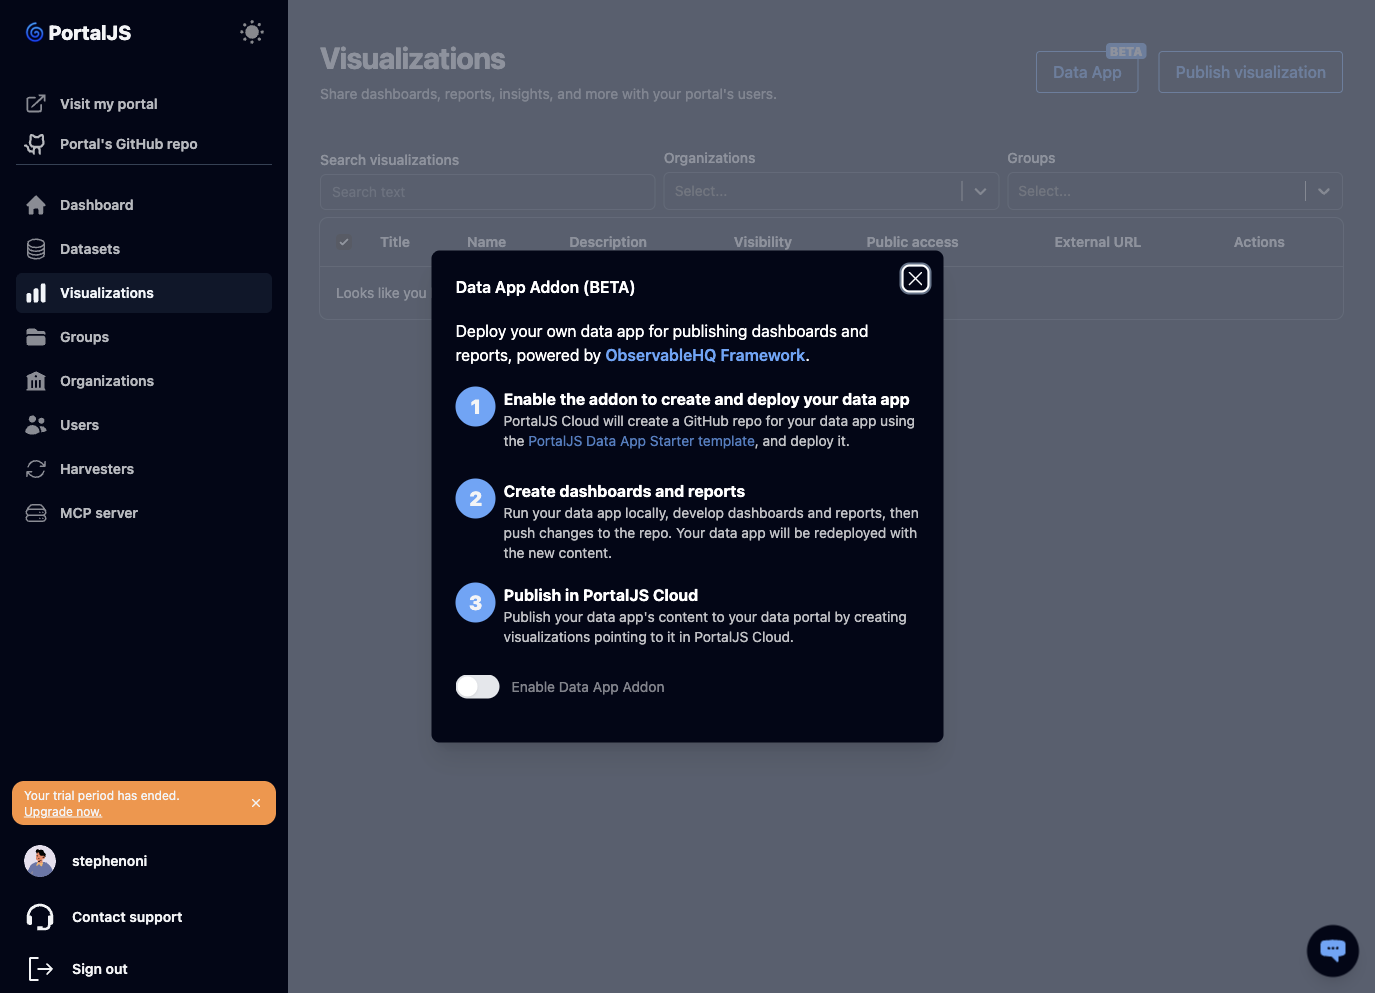
Data App Addon (BETA)
If you do not already host a dashboard or report somewhere, the Data App Addon can create and deploy one for you. It is powered by the ObservableHQ Framework.
-
On the Visualizations page, click Data App (marked BETA).
-
In the modal, enable the addon. PortalJS Cloud then:
- Creates a GitHub repository for your data app from the PortalJS Data App Starter template and deploys it.
- Makes it available at
https://app.<your-org>.portaljs.com.
-
Develop your dashboards and reports: run the data app locally, build your content, then push changes to the repository. The app is redeployed with the new content.
-
Publish the result by creating a visualization (see Publish a visualization) whose External URL points to your data app.
While the addon is provisioning, the modal shows progress (Creating your Data App, Deploying your Data App) and, once ready, a Visit Data App link and a Data App GitHub repo link.